What Is Value Stream Mapping? Basics for Local Businesses
Step-by-step VSM guide to map processes, eliminate waste, and speed delivery for small local businesses.
What Is Value Stream Mapping? Basics for Local Businesses
Value Stream Mapping (VSM) is a simple yet powerful tool for businesses to identify inefficiencies and improve processes. It visually maps the flow of materials and information from start to finish, helping you pinpoint waste and streamline operations. For small businesses, especially for businesses in Rockwall, Texas, this can lead to faster delivery times, reduced costs, and happier customers - all without the need for expensive tools or software.
Key Takeaways:
- VSM tracks every step of your process, highlighting areas where time and money are wasted.
- You can start with basic tools like a whiteboard and stopwatch - no fancy software required.
- By focusing on value-added activities and cutting out delays, businesses can improve efficiency and customer satisfaction.
- Local examples, like cafés or repair shops, show how small changes can make a big impact.
In this guide, we’ll explore how to create a VSM, identify waste, and implement changes to improve your business operations.
What Is Value Stream Mapping?
Definition and Purpose
Value Stream Mapping (VSM) offers a clear, detailed look at how materials and information flow through a process, from the initial order to final delivery. It breaks down each step, showing not just the actions taken but also the time involved.
Though its roots trace back to the early 20th century, VSM gained prominence in the 1950s as part of Toyota's production system. It was later formalized in the 1990s by Mike Rother and John Shook in their book Learning to See.
What sets VSM apart is its use of a timeline to separate value-added activities from non-value-added ones. Surprisingly, in many businesses that haven't optimized their processes, only 1% to 5% of the total lead time actually adds value. The remaining 95% to 99% is waste.
To put this into perspective, think of a Rockwall roofing company. Installing shingles is a value-adding activity because it directly contributes to the finished product. On the other hand, waiting for materials to arrive is pure waste.
By understanding how VSM is structured, businesses can unlock opportunities to make their operations more efficient and effective.
Key Benefits for Small Businesses
For small businesses in Rockwall, VSM offers a practical way to cut costs and improve efficiency. By laying out every step in a process, it becomes easy to identify inefficiencies and eliminate them. For example, instead of debating whether a process is slow, teams can rely on the visual clarity of a VSM chart to see exactly where delays occur. This shifts discussions from subjective opinions to data-backed solutions.
One of the most immediate outcomes of using VSM is faster delivery times, which naturally leads to happier customers. When waste is reduced, businesses can serve clients more quickly, creating a better overall experience. For local businesses, this can mean more repeat customers and a stronger foothold in the competitive Rockwall market.
The best part? VSM is simple and accessible. You don't need fancy tools or expensive consultants to get started. A whiteboard, sticky notes, and a stopwatch are enough to begin mapping your processes. Plus, small businesses, with their ability to adapt quickly, can implement changes without the red tape that often slows larger organizations. This makes VSM an ideal tool for improving efficiency and staying competitive.
sbb-itb-bbaa742
How to Value Stream Map [STEP BY STEP]
Core Components of a Value Stream Map
Building on the basics of VSM, let’s dive into its essential parts.
A value stream map lays out the entire process flow, with each element highlighting a different aspect of the system - from the actual work being done to the delays between steps. By breaking it down, you can pinpoint exactly where time and money are being lost.
Process Boxes
Process boxes are the rectangles on the map that represent individual steps where work happens. For instance, a Rockwall HVAC company might include steps like "diagnose issue", "order parts", "install unit", and "test system." Each box contains specific details, such as:
- Cycle time: How long it takes to complete one unit.
- Changeover time: The time needed to switch between tasks.
- Uptime: How often equipment is available and functioning.
- Operators: The number of people working on that step.
This data highlights where work is actively taking place and helps identify bottlenecks. For example, if one step has a cycle time longer than your production pace, you’ve found a clear problem. The trick? Use observed data - grab a stopwatch and walk the floor. Estimates provided by managers can often be way off, sometimes by a factor of 2 or 3.
Once you’ve mapped the work, it’s time to look at how information and materials flow between these steps.
Information and Material Flow
While process boxes focus on the work itself, information flow and material flow show what happens between those steps.
- Information flow (usually drawn at the top of the map with arrows) illustrates how tasks receive instructions - whether through production schedules, customer orders, or verbal communication. This helps you see if your system operates on a "push" model (work sent regardless of readiness) or a "pull" model (work triggered by downstream demand).
- Material flow tracks how physical items or products move through the process. Arrows show the direction, while inventory triangles mark Work-in-Progress (WIP) - items waiting between steps. For instance, a Rockwall bakery might have trays of cookies sitting idle, waiting to be packaged. These symbols expose hidden buffers that inflate lead times and reveal where work stalls. Often, misaligned information flow leads to overproduction and excess inventory.
With these flows mapped out, the timeline provides the final piece of the puzzle.
Timeline Analysis
The timeline (or lead-time ladder) at the bottom of the map is what sets value stream mapping apart from a standard flowchart. Unlike a simple flowchart, the timeline quantifies waste by breaking lead time into active work and delays. This visual comparison makes inefficiencies impossible to ignore.
“Don’t be surprised if a product with weeks of lead time takes just a few hours of actual work. That gap? That’s where your waste lives.” – Amit Kothari, CEO, Tallyfy
The timeline also calculates efficiency using the value-added ratio (cycle time divided by lead time). This single number provides a clear metric for improvement that leadership can easily grasp. For instance, if only 3% of your lead time adds value, the need for change becomes hard to argue against.
Steps to Create a Value Stream Map
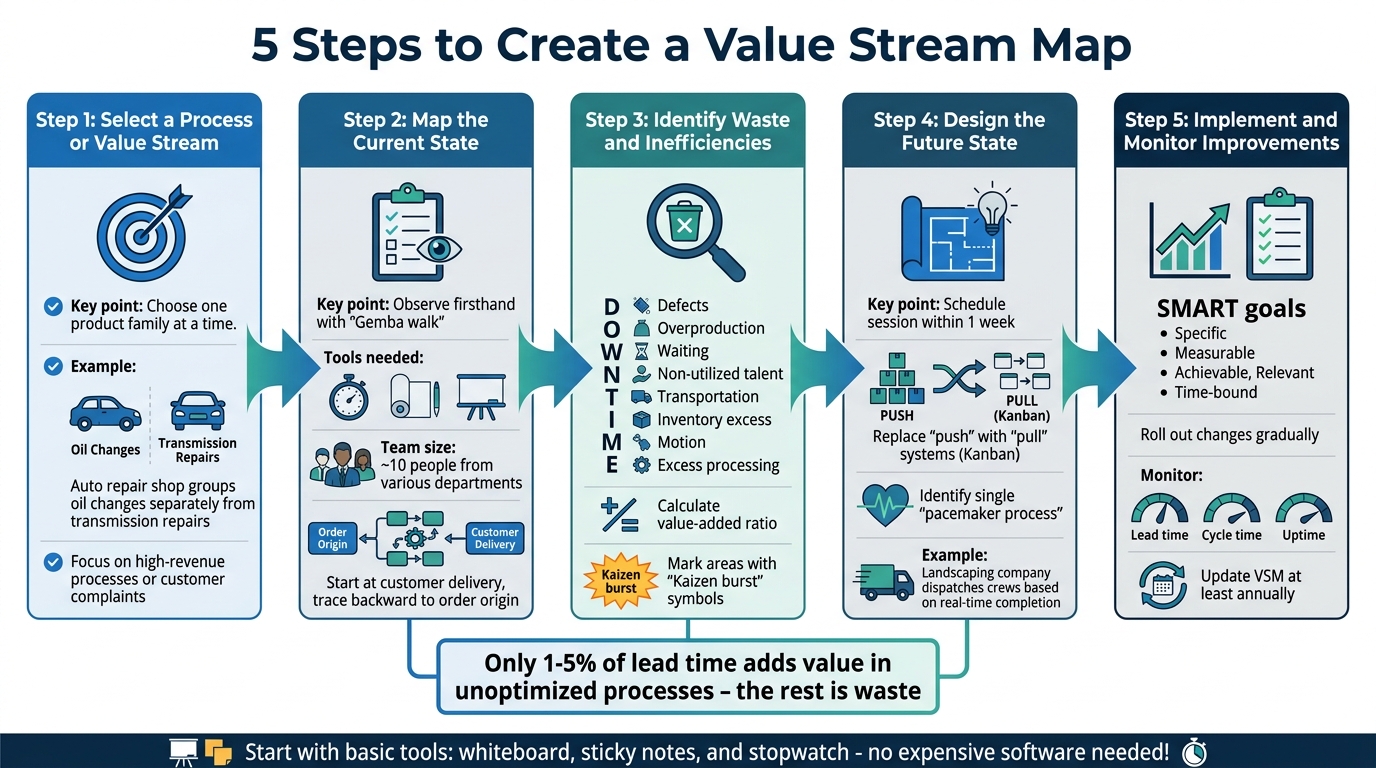
5-Step Value Stream Mapping Process for Small Businesses
Creating a value stream map requires direct observation and a structured approach. Follow these steps to turn what you see into actionable improvements.
Step 1: Select a Process or Value Stream
Start by focusing on one product family at a time. A product family includes items or services that follow similar steps in your operations. This keeps the process manageable and allows you to zero in on specific inefficiencies. For example, an auto repair shop in Rockwall might map oil changes and basic maintenance services as one group, while handling transmission repairs as a separate process. Choose a process that significantly impacts your revenue or addresses frequent customer complaints to ensure your efforts yield meaningful results.
Step 2: Map the Current State
Don't rely on assumptions or outdated manuals - observe the process firsthand. Walk through the workflow yourself, starting at the customer delivery point and tracing backward to where the order begins. This method, often called a "Gemba walk", helps uncover how work truly flows. Use a stopwatch to time each step accurately and count any inventory between stages. Speak directly with employees performing the tasks rather than relying solely on supervisors. To get a full picture, assemble a team of about ten people from various departments. At this stage, a simple sketch on paper or a whiteboard works just fine - there’s no need for fancy tools or software.
Step 3: Identify Waste and Inefficiencies
Once your current state map is complete, you'll begin to see areas of waste more clearly. Use the DOWNTIME framework to identify eight common types of waste: Defects, Overproduction, Waiting, Non-utilized talent, Transportation, Inventory excess, Motion, and Excess processing. For instance, a restaurant in Rockwall might discover that prep cooks spend 30 minutes every morning walking to a distant storage area (Motion waste) or that they’re preparing 50 sandwiches for lunch when only 35 typically sell (Overproduction waste). Calculate the value-added ratio to pinpoint where waste is concentrated, and use "Kaizen burst" symbols to highlight areas needing improvement.
Step 4: Design the Future State
Turn your observations into actionable plans quickly. Schedule a future state design session within a week to keep the momentum going. In this session, redesign your workflow to eliminate identified waste. Consider replacing "push" systems - where work progresses regardless of demand - with "pull" systems like Kanban. In a pull system, each step only produces when the next one signals it’s ready. Identify a single "pacemaker process" where the customer schedule is received, triggering all downstream steps. For example, a landscaping company in Rockwall might stop pre-scheduling all jobs at the start of the week and instead dispatch crews based on real-time completion of previous tasks. This reduces lead times while maintaining quality.
Step 5: Implement and Monitor Improvements
Break your future design into clear, manageable tasks. Each task should be specific, measurable, achievable, relevant, and time-bound (SMART). Assign responsibilities and deadlines to ensure accountability. Roll out changes gradually instead of overhauling everything at once. Monitor key metrics like lead time, cycle time, and uptime to measure the effectiveness of your changes. For instance, a plumbing company in Rockwall might start by reorganizing truck inventory to save time searching for parts, then move on to optimizing its dispatch process. Update your value stream map regularly - at least once a year or after any major operational change. Remember, the map itself isn’t the goal; the real value lies in using it to bridge the gap between perception and reality and taking meaningful action.
How Rockwall Businesses Can Benefit from VSM
Examples for Local Rockwall Businesses
With Rockwall's population growing by over 650 residents annually and a projected 17% increase in the next five years, local businesses are under pressure to scale operations efficiently while maintaining quality standards. Value stream mapping (VSM) provides a straightforward way to streamline processes across various industries.
Take, for instance, a café near The Harbor at Lake Ray Hubbard. By mapping out every step in the order-to-serve process, the café could identify inefficiencies such as unnecessary movement or excessive waiting times. Studies show that up to 95% of process time in such cases could be non–value-added. Something as simple as relocating often-used ingredients closer to the espresso machine could shave minutes off each order, improving both speed and customer satisfaction.
Similarly, service businesses like Integrity Transmission & Auto Repair on I-30 Frontage Road could benefit from VSM by examining their parts ordering and approval workflows. Mapping their current process might reveal that vehicles remain idle for hours due to delays in customer approvals or parts delivery. A pull system, where parts are ordered only when the previous repair step is complete, could drastically reduce these delays and improve turnaround times.
Professional service firms, such as Shooter & Agee Law Group or APlus Payroll, can also use VSM to optimize internal workflows. By analyzing the journey from client request to final deliverable, these firms can uncover bottlenecks during handoffs between team members. Addressing these delays can lead to faster response times and better client satisfaction.
Using Local Resources
The examples above show how VSM can create meaningful improvements, but leveraging local resources can make the implementation process even smoother. The Rockwall Area Chamber of Commerce, located at 697 E I-30, offers a business directory and hosts networking events. These resources can connect you with lean-focused consultants, suppliers, or other business owners who have successfully improved their processes.
"With a Chamber membership, you're never alone... [leaders] are all willing to share ideas and help you develop a roadmap for success." – Shannon Thompson, APlus Payroll
Ben Agee of Shooter & Agee Law Group also highlights the Chamber as a critical resource for business growth.
Additionally, RockwallConnect.com provides a searchable directory of local businesses that can support your VSM initiatives. Whether you need a local printer for creating visual process boards, a software consultant to document standard operating procedures, or nearby suppliers to minimize transportation waste, this platform connects you with Rockwall-based providers. By sourcing locally, you not only reduce lead times but also contribute to the community's economic growth. Utilizing resources like RockwallConnect.com ensures businesses can implement VSM strategies more efficiently and effectively.
Conclusion
VSM offers Rockwall businesses a practical way to reduce waste, cut costs, and improve customer satisfaction. By mapping out the entire flow of materials and information, local entrepreneurs can pinpoint the eight types of DOWNTIME waste that can drain up to 20% of revenue in manufacturing. The best part? You can kick things off with nothing more than a whiteboard and a pen.
The real power of VSM comes from mapping both current and future states with your team. This hands-on method replaces guesswork with real data, like actual cycle times and inventory levels. As Owen McGab Enaohwo puts it, "The changes suggested have to make sense for the person on the ground... If the people see the inherent benefit which can be gained by transitioning to the new state, they won't resist it". This collaborative approach helps break down silos and fosters a shared understanding across your business.
For Rockwall's thriving business scene, adopting VSM can be the key to scaling efficiently. Whether you're running a café by The Harbor, a repair shop along I-30, or a professional services firm downtown, the principles are universal: cut out what doesn’t add value, refine what does, and keep improving. Tapping into local support ensures these changes are not only effective but also sustainable.
Rockwall businesses have resources at their fingertips to make VSM implementation easier. RockwallConnect.com is a hub for finding local consultants, suppliers, software providers, and even printing services for visual process boards. By sourcing locally, you not only reduce lead times but also contribute to Rockwall's economy. Head over to RockwallConnect.com today to connect with local partners and start optimizing your operations.
FAQs
How do I choose the right process to map first?
To kick things off, pinpoint the process that’s bogged down by the most waste or inefficiency. Look for steps that create delays, involve unnecessary movements, or stretch lead times longer than they need to be. Focus on processes that are vital to your operations or directly impact customer satisfaction - fixing these first can lead to quick improvements and offer helpful lessons for the future. By targeting the most problematic or influential process, you’ll set yourself up to get the most out of your initial value stream mapping efforts.
What numbers should I measure for a VSM?
When working on value stream mapping (VSM), it's crucial to track key metrics that shed light on process efficiency. Pay attention to:
- Cycle times: The time it takes to complete each step in the process.
- Wait times: The idle periods between steps where no work is being done.
- Lead times: The total time from the initial request to the final delivery of the product or service.
- Inventory levels: Useful for identifying bottlenecks in the workflow.
These metrics are your tools for spotting inefficiencies, uncovering waste, and shaping a future-state map that reduces lead times and improves the overall process flow.
How do I turn a VSM into real changes quickly?
To make a Value Stream Map (VSM) lead to actionable changes, start by walking through the actual process step by step. Measure each stage to understand how it compares to the ideal workflow. Look for areas where waste occurs - like long wait times or unnecessary steps - and focus on eliminating those inefficiencies.
From there, prioritize specific improvements and put them into action right away. Once implemented, monitor the outcomes to ensure the changes are making a difference. Think of the VSM as more than just a diagram - it should be a living, adaptable tool that helps you make real-time adjustments and improvements.
Related Rockwall Businesses
-
Lead Fuel CRM
Your Entire Business in One App. Phone, email, text, invoicing, contracts, automation, AI, websites, funnels, reviews, s
-
PxlPerfect Designs
At PxlPerfect Designs, we believe in more than just websites and SEO - we believe in helping businesses grow, supporting
-
Dr. Charles M. Russo, PhD
I teach business leaders and entrepreneurs to make better decisions through sharpening critical thinking skills . Provid
-
Home Flex Media
We are a real estate media team that specializes in luxury homes. We create listing photos and marketing videos for you
-
PLF Art Services
PLF Art Services. Our mission is simple: to help your business get SEEN, RECOGNIZED and CHOSEN to INCREASE YOUR REVENUE.
-
Arctic Spas Rockwall
Hot Tubs, swim Spas & Coldtubs Engineered For The World's Harshest Climates